Richard K. Koelsch
Professor, Biological Systems Engineering and Animal Science, University of Nebraska

Summary
This article is the third of a three-part summary of information shared at the Large Dairy Herd Management Conference held in Chicago in May 2-5, 2016. Part 1 introduced the concept of Whole Farm Nutrient Balance (WFNB). Part 2 shared summarized WFNB observed by three studies on dairies in New York, Idaho and Utah, and Idaho alone. This final discussion will share information on estimating WFNB and options for improving a surplus of nutrients on dairies.
Take home message from first two article:
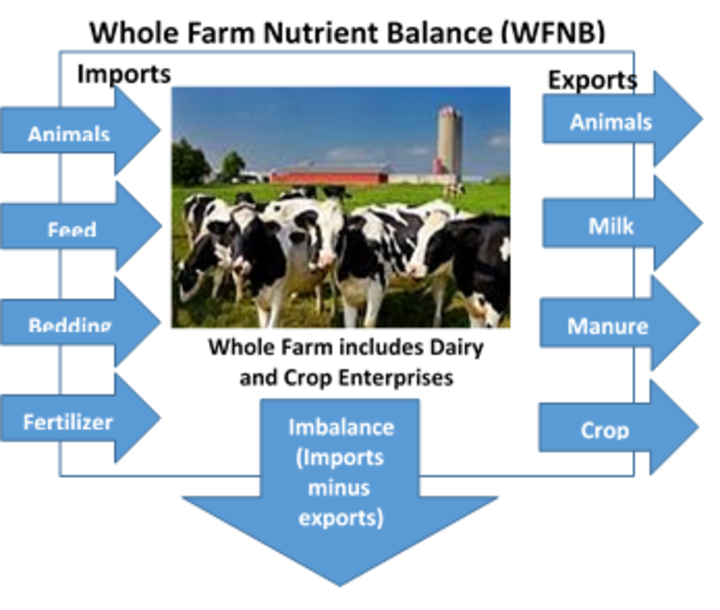
- A dairy farm’s environmental risk (due to nutrients) is measured by the imbalance between imported nitrogen and phosphorus (e.g. purchased feed) with nutrients exported off-farm in managed products (e.g. milk).
- Imbalances (especially N and P surpluses) are common on dairies.
- Imported feed is the largest source of imported nutrients, suggesting efforts to reduce imported feed nutrients may have important environmental benefits.
- Because fertilizer is a minor imported nutrient on farms with exception of those with sizeable land base, traditional nutrient plans to use manure more efficiently to replace may have modest to no benefit for some dairies.
Is There a Feasible WFNB?
Many commercial New York dairies have voluntarily applied WFNB measures to reduce their environmental footprint. Based upon data collected over the last 15 years, targets have been identified for achievable balances (Figures 1 and 2).
The complex N flow pathways in our livestock and cropping systems and the influence of the environment

lead to unavoidable N losses, even on well managed dairies. Additional N must be imported to offset the losses within the farm. Thus a reasonable balance for N is positive but not excessive (Figure 1). Nutrient planning experts with Cornell Cooperative Extension propose that a farms with a surplus of 105 lbs. N per acre or less is a reasonable goal. Phosphorus is generally better conserved in agricultural systems. As such, this same group recommends P surpluses of 12 lbs. of P or less to be reasonable (Figure 2).
Also note the wide variation in results observed by individual farms in Figures 1 and 2. For example, farms
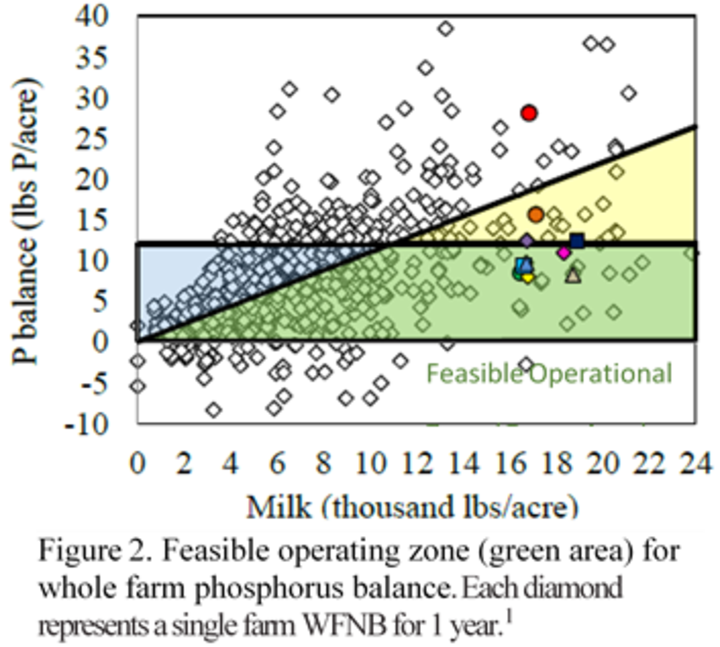
producing 10,000 lbs. of milk per acre of tillable land experienced imbalance ranging from -5 lbs. P/acre to +30 lbs. P/acre. Much of that variation can be explained by differences in management of individual dairies. Thus, understanding the management practices of those achieving smaller surpluses will assist those dairies with larger surpluses to reduce their environmental risk.
How Do I Calculate My Dairy’s Whole Farm Nutrient Balance?
Several software tools are available for estimating a whole farm nutrient balance. Two commonly used tools available for downloading can be found at
- Whole Farm Nutrient Balance Software, Cornell University. This Microsoft Visual Basic© program is to assist in conducting a mass nutrient balance analysis.
- Nebraska CNMP Whole Farm Nutrient Balance, University of Nebraska. An Excel spreadsheet and instructions is used to create a whole farm nutrient balance for all typical livestock and poultry species.
Depending upon current farm records, assembling a WFNB for a one-year period can require 4 to 10 hours of work. Much of that variation will depend upon your current records for purchased feed ingredients (and their crude protein and phosphorus concentrations), purchased fertilizers, and quantity of manure moved off-farm.
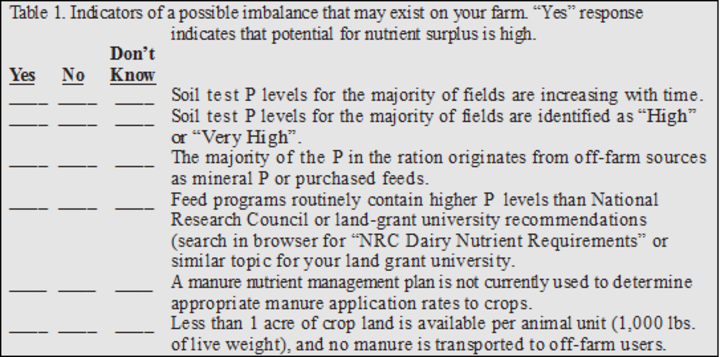
It is possible to perform a “quick check” of P balance (see Table 1). A quick check of the N balance is less reliable as N is commonly lost even under a well-managed dairy system. Thus, Table 1 indicators are for P balance only. If a quick check suggest an imbalance is a possibility for your own farm, a follow up evaluation using one of the above tools would be recommended.
What Options Will Improve an Imbalance?
Manure Used to Replace Imported Fertilizer: This may not always be the most valuable solution, but it is the mandatory solution required of every NE Department of Environmental Quality permitted dairy. It will have the greatest benefit for improving WFNB for those dairies with a larger land base and limited benefit to those dairies that rely on imported feeds for the majority of their dairies feeding program. For more information on using manure efficiently in your cropping system, review NebGuide G1335, Determining Crop Available Nutrients from Manure.
Manure Export: Larger dairies with limited land base can improve their balances by exporting manure to an outside party such as a neighboring crop farm. Among the Utah and Idaho dairies discussed in part 2 of this series, this measure was commonly used (and often essential).
Increasing Arable Land Access: While adding land to a dairy is not an option for all farms, it can be a powerful measure for those with purchase or rental options available within a reasonable distance. Adding land will reduce the need to purchase feeds and provide additional options for manure applications, allowing for more efficient use of manure nutrients.
Reducing Imported Feeds: Previously we learned that imported feed is the single largest source of N and P arriving on dairies. Multiple research studies have identified the efficiency of a cow converting feed to milk as an important option often recommending options such as:
- Improving forage quality and reducing losses during harvest and ensiling;
- Adjusting dietary protein and P level to match better with animal requirements;
- Location of the replacement herd off the farm may reduce the farm’s imported feed requirements; and
- Evaluating by-product feeds high in P for potential contribution to high P imbalances.
Bottom line, careful management of the feeding program is every bit as important to a dairy’s environmental impact as manure management decisions.
Will These Options Make a Difference?
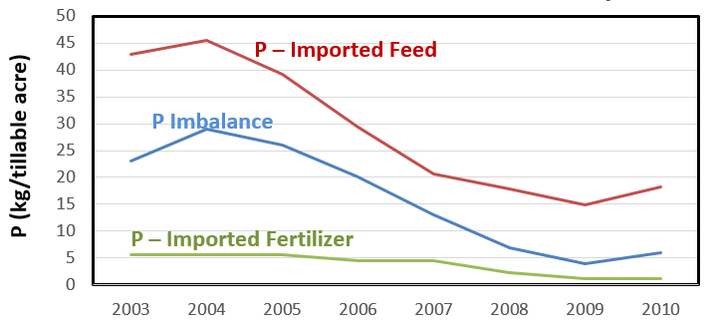
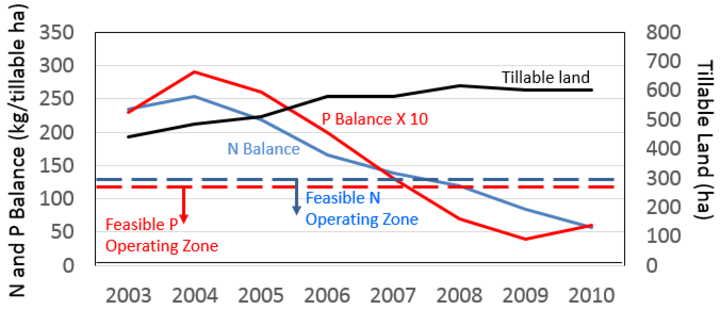
Many New York dairies voluntarily have used WFNB as a management tool for reducing their environmental impact for the past 15 years or more. For example, Figure 3 illustrates an 8-year journey for a 640 cow New York dairy that increased its tillable acres, reduced purchased feeds, and improved crop nutrient planning all in an effort to improve N and P balances. These changes resulted in the dairy achieving the feasible operating range in about 2008.
Participating farm managers discuss the importance of annual assessments of WFNB and their ability to review value of the incremental changes made over time. For this example NY dairy, it is difficult to overlook the connection of imported feeds to overall farm balance for P (Figure 4). The annual measure of WFNB helped this dairy track its progress and identify those changes that produced the greatest bang for the buck.
Take Home Message from Part 3:
- Whole Farm Nutrient Balance provides a unique measure of a dairy’s environmental performance and can be used to help identify those management changes that produce the greatest bang for the buck.
- Managing manure efficiently to replace commercial fertilizer is an important (and required for larger dairies) to minimizing environmental impacts. However, dairies that rely on off-farm sources of feed and maintain limited land for growing feed will not achieve an acceptable environmental performance with this measure alone. Many dairies will find that efforts to reduce imported feed nutrients or increase manure export to be essential to their nutrient solutions.
- Whole Farm Nutrient Balance is strictly a voluntary approach to nutrient planning that is gaining favor in regions where nutrient driven water quality problems are gaining significant public scrutiny.
1. Reference for Figure 1 and 2. Characterization of nitrogen, phosphorus, and potassium mass balances of dairy farms in New York State. http://www.journalofdairyscience.org/article/S0022-0302%2814%2900722-X/abstract
2. Reference for Figure 3 and 4. Whole Farm Nutrient Balance Calculator for New York Dairy Farms. https://dl.sciencesocieties.org/publications/nse/abstracts/42/1/57